Showing posts with label excel. Show all posts

Friday, July 20, 2012

The Size of National Economies Version 2


In this post I wanted to  have a another go at the figures I made a few months ago in "The Size of National Economies".

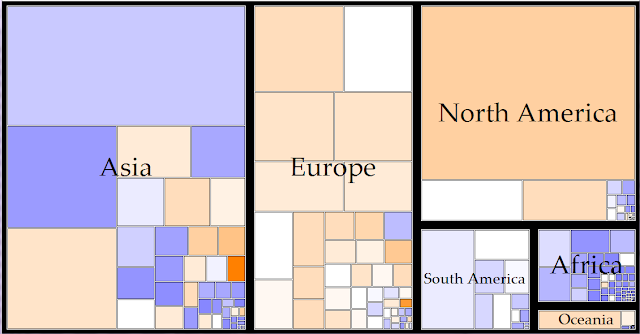
I have since found out that these diagrams are called treemaps. Treemaps can display hierarchical data by placing appropriately sized rectangles nested within each other. The data I am using (World GDP) has been grouped into the six continents, then into individual nations. The size of each box represents the size of the respective nation's economy, and the colour of each box indicates the level of per-capita income, with blue boxes indicating a very low per-capita income and orange boxes indicating a very high per-capita income. A couple of these treemaps are displayed below.


I think these charts are very informative on wealth and income levels in different parts of the world. The first treemap illustrates the point that the economic world is dominated by the Northern Hemisphere. Asia, Europe and North America contribute over 90% of World GDP. It is also interesting to compare the wealth of different continents. The colouring of the rectangles shows us that European countries generally have a high level of income while African countries have a low level of income.

Any comments or questions are welcome. Thanks for reading.

Wednesday, January 4, 2012

How do we measure inequality? Part one: Gini coefficient (Continued)

In my last blog post I discussed the Gini Coefficient as a way of measuring inequality. In this post I want to use this Coefficient to see if inequality in New Zealand has changed in the last 10 years or so.


As discussed in the previous post, I have used income data from the IRD, and excluded people who I knew were definitely working part-time.The following results were obtained using excel:

  
<><><><>
Year
Gini Coefficient
2001
0.356
2002
0.360
2003
0.353
2004
0.355
2005
0.353
2006
0.342
2007
0.320
2008
0.318
2009
0.314


As we discussed in the last post, a higher Gini value indicates higher inequality. From the table and chart we can see that income inequality has fallen in the last ten years, particularly in the period from 2005 to 2009.

The New Zealand Institute, the privately funded think-tank have also provided data on inequality and Gini Coefficients. Their figures roughly correspond to my own figures (Which is hugely encouraging from my own standpoint, I know my calculations are correct). The NZ Institute have compared our Gini figure to the rest of the OECD, where in terms of equality, we rank 25 out of 34 (http://www.nzinstitute.org/index.php/nzahead/measures/income_inequality/).
So although equality has improved in recent years, there is still some work to do to catch up with the rest of the developed world. The NZ Institute link above has some great information for those wanting to know more about Inequality in New Zealand.

I don't really want to draw any conclusions over these figures, but the downward trend is encouraging. I need to point out that data I have used is far from perfect. For starters I have effectively excluded any unemployed individuals, as on the dole they would not earn enough to enter my analysis (discussed in the previous post).

If you have any questions or comments, please feel free to make a comment. In the next post I will stop talking about inequality for a while and will discuss a few minor issues I have with Statistics New Zealand.

Bye

Thursday, November 24, 2011

How do we Measure Inequality? Part one: Gini coefficient

In this post I will discuss inequality and the Gini coefficient, which is one particular way of measuring inequality. In this post I will discuss the concept and how it is calculated, and in the next post I will use it to see if income inequality in New Zealand has changed in the last 10 years.

Inequality is a slightly more exotic and complicated concept when compared the basic economic indicators of GDP, unemployment, and inflation  When we are talking about inequality in economic terms, we are talking about differences in the distribution of wealth and income. All societies have some inequality, as some people are richer and earn more than others. Throughout history, high levels of inequality have been associated with revolution, the creation of political systems and the formation of new governments. The recent worldwide Occupy movement and uprisings in the Arab world are recent examples of this.

Defining and discussing inequality are simple matters. Trying to measure it however opens up a very contentious can of worms. Firstly, are we measuring wealth inequality, or income inequality? (This is not a big issue, as people with high levels of income are generally wealthy).

Secondly,because of its arbitrary nature inequality cannot be measured in the same way as GDP, unemployment, or inflation. For example the statement "Society A is 50% percent more equal than society B", makes no sense. There are many indices for measuring inequality (for example, the Hoover Index, the Theil Index, Gini Coefficient,...). The common inequality indices all give results between 0 (perfect equality) and 1 (perfect inequality), or 0% and 100%. However, because these indices use different formulas, each index will give a different value of inequality for the same society. compared to GDP or unemployment, interpretations of inequality figures cannot be made with the same authority.

Now that I have discussed a few issues with inequality, I will use the Gini coefficient to measure it. Subsequent posts will look at the other measures. I have started with Gini because it has an elegant visual basis.

The Gini coefficient is based on the Lorenz Curve. This curve plots the cumulative share of people ordered from lowest to highest income (from 0-100%) on the x-axis, and the cumulative share of income earned (from 0-100%). The Lorenz Curve for New Zealand income in 2009 is shown below. For this curve I only want consider full-time workers, so I have removed anyone who earns less than $19500 in that year (assuming a minimum wage of $12.50 per hour and a 30 hour work week, 12.5x30x52 weeks = $19 500) from this analysis.


A society that is perfectly equal will have a Lorenz curve that shoots out from the origin at a 45 degree angle. This is represented by the red line in the diagram below. With this red line, the cumulative share of population and the cumulative share of income increase at the same rate, resulting in perfect equality.  (For example, the "bottom" 10%  of the population would earn 10% of the income, the "bottom" 20% of the population would earn 20% of the income, and so on). Lorenz Curves that are closer to this 45 degree line will be associated with societies that are relatively equal. Conversely, societies that are more unequal will have more "bent" Lorenz Curves farther away from the 45 degree line.


From the Lorenz Curve we can find the Gini Coefficient of an economy by calculating A/A+B.

Using New Zealand individual income data from the IRD, I have calculated that the Gini Coefficient for New Zealand in 2009 was 0.31, so I know my calculations and methods are robust. This figure is very close to the Ministry of Economic Development's own figure of 0.32 for the same time period. The small difference arises due to the Ministry's use of household income for the calculations, while I used individual income.

In my next post I will the Lorenz curve to Calculate the Gini Coefficient for previous years to see how inequality in New Zealand has changed.

Bye for now.
Wednesday, October 12, 2011

What would your tax plan be?

Hello and welcome to my blog. In this post I provide an interactive excel spreadsheet (link provided below) that will focus on the debate around income tax, as this forms a significant portion of government revenue. In New Zealand, income tax forms about 29% of total government revenue.

There is no point in going on about the tension and argument that is associated with taxation issues. Everyone pays it, everyone is affected by it and so everyone has a stake in how the tax system is administered and arranged.

A lot of the debate around income tax centres around whether each unit of income should be taxed at the same rate (flat tax rate) or whether the rate of taxation should be increased as income increases (also called a progressive tax system, as the rate of tax "progresses" as your income increases). Some political groups prefer a flatter system, while others prefer a more progressive system.

New Zealand has a progressive income tax system, as the marginal tax rate (tax per unit of income) increases as you move through the following income bands:

up to $14 000                    10.5%
$14 000 to $48 000         17.5%
$48 000 to $70 000         30%
over $70 000                     33%

With this excel chart (follow the link at the bottom of the page) you can experiment with different tax rates to see their effect on revenue. Instructions are provided in the chart. I have used New Zealand's 2009  income distribution information from the IRD, assuming that 2009's income distribution is close enough to the current distribution to be relevant.

Naturally this sheet does have some limitations and points to note:

  • The data I have (2009's income distribution figures) are slightly out of date, which could lessen the validity of any results.
  • It cannot take into account income changes caused by tax changes. I'm talking here about an individuals incentive to earn when their marginal tax rates are changed. This means that any findings should be taken with a pinch of salt.
  • Because of the point made in the last bullet point, the spreadsheet shouldn't be used to test extreme tax rates.
  • The sheet compares revenue based on the 2009 tax rates, which were changed late last year.

I've done some initial experiments with the chart.
  • It turns out that a absolute flat tax rate of around 23-24% would gather around the same amount of revenue that was ACTUALLY collected in 2009 (in other words a change to a flat 24% income tax would be "revenue neutral").
  • The current tax rates would generate about 79% of the revenue that was ACTUALLY collected in 2009.
  • To "test" the chart, I entered the 2009 tax rates (plus the ACC earners levy). according to the chart, this generated almost the exact amount of revenue collected, making me feel a bit more confident on the validity of the chart.
Well, that's all I want to say for now. I'll probably talk a bit more about the spreadsheet and tax in my next post. I really would like to hear your comments, questions, suggestions and findings from experimenting with the chart.

bye

Here is the link. The file needs to be downloaded to be experimented with.
https://docs.google.com/leaf?id=0B66NnPdYPuFfN2QzNjY4MDktNzFlYi00NWJlLWE0MmMtYjliMGU2MGRlMWVj&hl=en_US